SparkWaterfall
This part of the project documentation focuses on a learning-oriented approach. Use the tutorial below to learn how this package can be useful.
California housing data
In this tutorial you'll learn how the SparkWaterfall can log and plot several filtering steps on the California housing dataset.
Helper functions
Below you can find several helper functions to scope or filter the dataset.
from typing import Dict, Any

import pyspark
import pyspark.sql.functions as F

def filter_bedrooms(sdf: pyspark.sql.DataFrame, settings: Dict[str, Any]):
    """Filters houses with at least one bedroom in the block."""
    return sdf.filter(F.col('AveBedrms') >= settings['min_bedrooms'])

def filter_household_members(sdf: pyspark.sql.DataFrame, settings: Dict[str, Any]):
    """Filters houses for one or two household members."""
    return sdf.filter(F.col('AveOccup') <= settings['max_occupants'])

def filter_house_age_range(sdf: pyspark.sql.DataFrame, settings: Dict[str, Any]):
    """Filters houses aged between two ages."""
    return sdf.filter((F.col('HouseAge') >= settings['house_age'][0]) & (F.col('HouseAge') <= settings['house_age'][1]))

def join_new_house_data(sdf1: pyspark.sql.DataFrame, sdf2: pyspark.sql.DataFrame):
    """Appends houses with an average number of bedrooms in the block between 0.5 and 1.0."""
    return sdf1.union(sdf2.filter((F.col('AveBedrms') >= 0.5) & (F.col('AveBedrms') <= 1.0)))
Logging
Below you can find the SparkWaterfall implementation for scoping a dataset imported from scikit-learn.
from sklearn import datasets
import pyspark
from waterfall_logging.log import SparkWaterfall

california_housing = datasets.fetch_california_housing(as_frame=True)
california_housing_df = california_housing.frame.reset_index()

spark_session = pyspark.sql.SparkSession.builder.enableHiveSupport().appName(str(__file__)).getOrCreate()
california_housing_sdf = spark_session.createDataFrame(california_housing_df)

settings = {
    'min_bedrooms': 1.0,
    'max_occupants': 2.0,
    'house_age': [10, 80],
    'join_new_houses': True,
}

waterfall_log = SparkWaterfall(table_name='california housing', columns=['MedInc', 'AveRooms'],  distinct_columns=['Population'])
waterfall_log.log(california_housing_sdf, reason='Raw california housing data', configuration_flag=None)

california_housing_sdf = filter_bedrooms(california_housing_sdf, settings)
waterfall_log.log(california_housing_sdf, reason='Select in-scope bedrooms', configuration_flag=f"{settings['min_bedrooms']}")

if settings['join_new_houses']:
    virgina_housing_sdf = spark_session.createDataFrame(california_housing_df)
    waterfall_log.log(virgina_housing_sdf, table_name='virginia housing', reason="Load Virginia's housing data", configuration_flag='n/a')

    california_housing_sdf = join_new_house_data(california_housing_sdf, virgina_housing_sdf)
    waterfall_log.log(california_housing_sdf, reason='Join houses w/ 0.5 to 1.0 average bedrooms', configuration_flag=f"{settings['join_new_houses']}")

california_housing_sdf = filter_household_members(california_housing_sdf, settings)
waterfall_log.log(california_housing_sdf, reason='Maximum two occupants', configuration_flag=f"{settings['max_occupants']}")

california_housing_sdf = filter_house_age_range(california_housing_sdf, settings)
waterfall_log.log(california_housing_sdf, reason='House age range', configuration_flag=f"{settings['house_age']}")

waterfall_log.to_markdown('output/tests/california_housing_sdf.md')

waterfall_log = SparkWaterfall(table_name='california housing sdf')
waterfall_log.read_markdown('output/tests/california_housing_sdf.md',
    sep='|', header=0, index_col=False, skiprows=[1], skipinitialspace=True
)
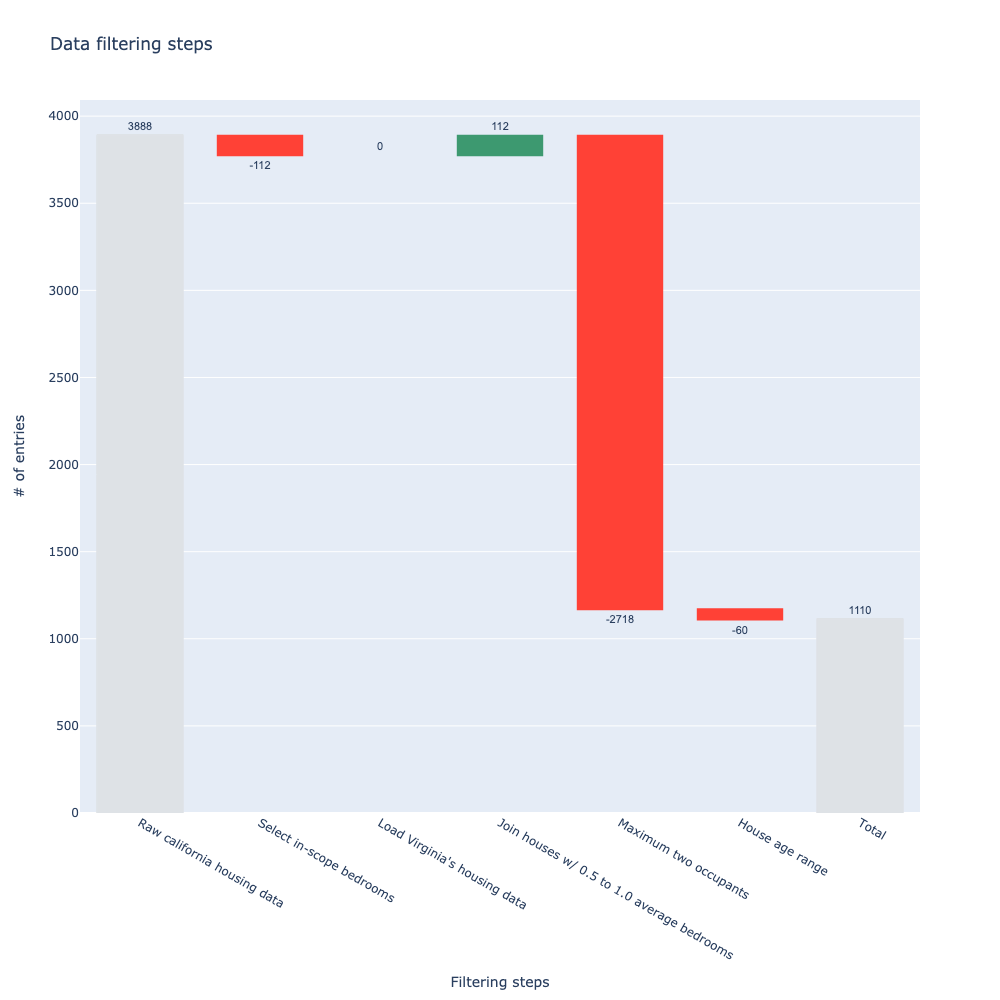
Plotting
Below you can see how to plot the markdown table.
fig = waterfall_log.plot(y_col='Population', y_col_delta='Δ Population', x_col='Reason', drop_zero_delta=False,
    textfont=dict(family='sans-serif', size=11),
    connector={'line': {'color': 'rgba(0,0,0,0)'}},
    totals={'marker': {'color': '#dee2e6', 'line': {'color': '#dee2e6', 'width': 1}}}
)

fig.update_layout(
    autosize=True,
    width=1000,
    height=1000,
    title=f'Data filtering steps',
    xaxis=dict(title='Filtering steps'),
    yaxis=dict(title='# of entries'),
    showlegend=False,
    waterfallgroupgap=0.1,
)

fig.update_traces(
    textposition='outside',
)

fig.write_image('output/tests/california_housing_sdf.png')